AI-powered Object Recognition Smart Glove

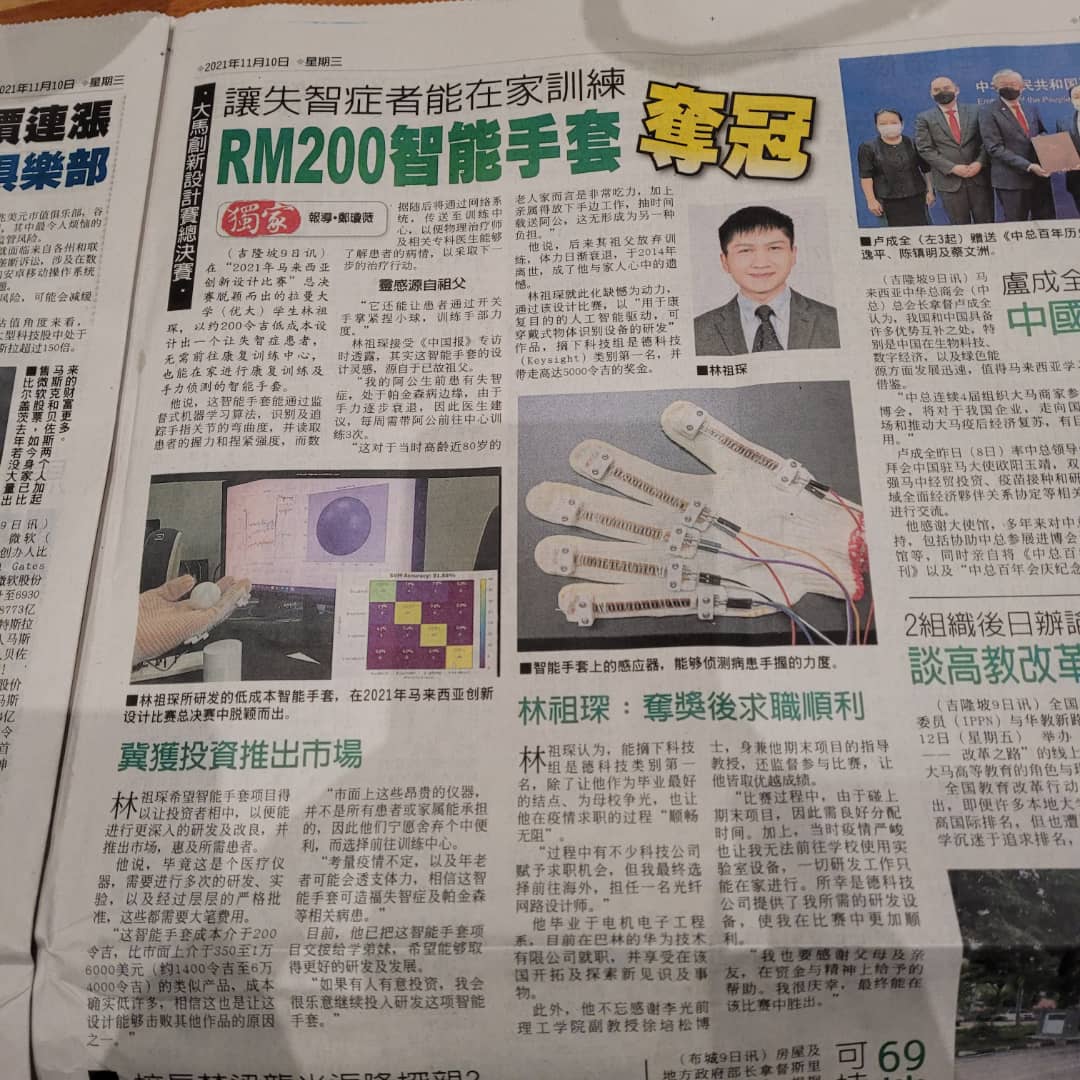
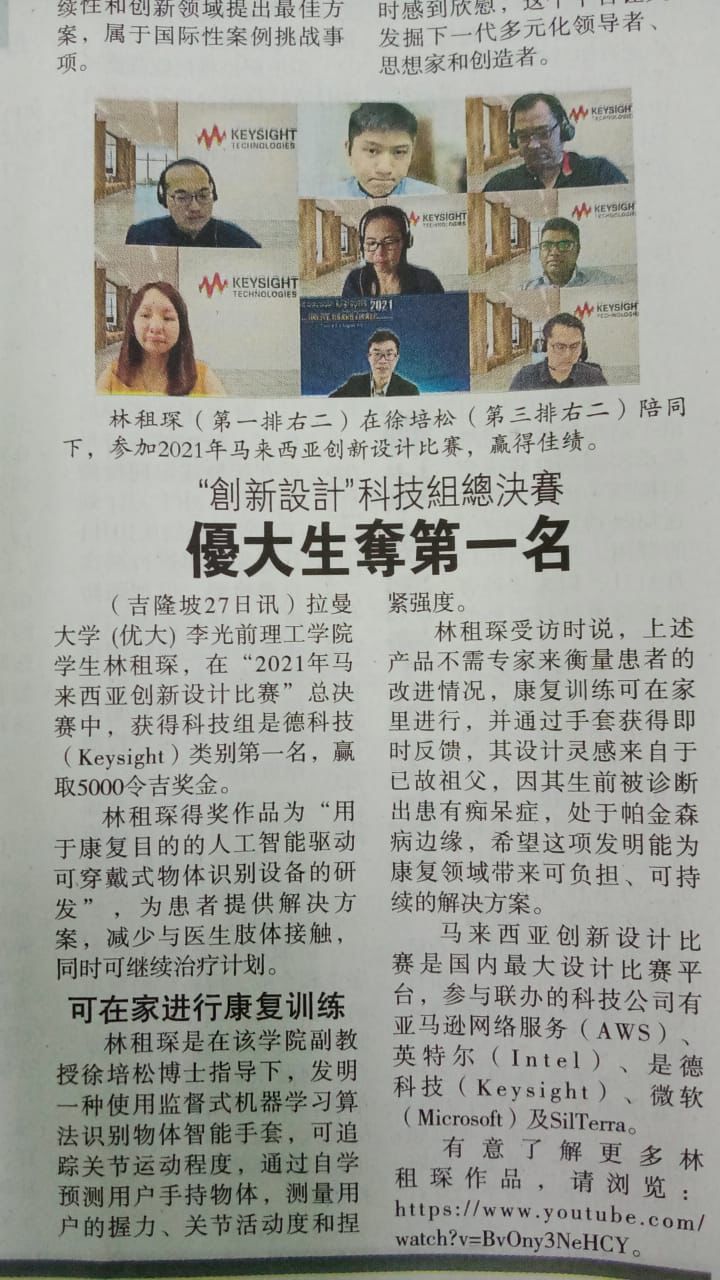
EDIT: This project won first place in the Innovate Malaysia Design Competition 2021 (IMDC 2021), the largest design competition in Malaysia with over 274 submissions from universities throughout the country. It was featured in my university’s website and also in multiple national news outlets including the China Press, Sin Chew Daily, and Nangyang Business Daily.

Introduction

Note: this project write-up is a condensed version of my research, for full research please refer to my Github link

During the final year of my bachelor’s degree, as a prerequisite to graduation, I was required to complete a final year project (FYP) as a way to gauge the research and practical skills that I’ve obtained throughout the years in the university.

As such, the research topic for my FYP was to design and fabricate a wearable electronic prototype equipped with an AI algorithm. The topic of this research was deliberately made open ended to allow for flexibility and creativity in the proposed solution and the problems it solves.

My proposed solution was to design a prototype for a wearable smart glove equipped with a machine learning model capable of recognizing the shapes of objects through resistive based flex sensors attached on each finger.

Purpose

The purpose of this project was to target the sector of remote monitoring for the rehabilitation of patients where hand motor functions are affected. This includes post-stroke patients or patients with neurodegenerative diseases such as Parkinson’s disease. This glove aims to assist by providing rehabilitation exercise data such as finger joint bending angle, improvement of finger joint movement over time and providing recommended hand exercises to rehabilitate specific hand-movement injuries. Moreover, the data obtained by the glove can also be sent remotely to a physiotherapist to gauge the progress of their patients.

Process

This section contains all the technicalities of the project, including the hardware and the software explanations. For those only interested in the results of this project, please scroll down to the next section.

Sensor Characterization

Before any software or hardware is implemented, I first have to characterize the flexible resistive sensor to ensure that I have an accurate estimation on how much the resistance changes in reference to the finger joint angle. To do that, I designed a very simple circuit to measure the analog voltage given a fixed input voltage.

This circuit is essentially a voltage divider with an op-amp set to a voltage follower to reduce the input impedance of the flex sensor. The resistance change within the flex sensor will cause a change in output voltage, Vout according to the voltage divider rule, where Vout = (R1/(R1+R2))*Vin.

Circuit diagram of characterization

Once the circuit is implemented, Vout is connected to an Arduino to read the output voltage. The output voltage can then be converted to resistance via the formula above.

Finger bending angle
Resistive change corresponding to the voltage output

From the graph below, it is clear that the full range of the index finger movement corresponds to a change in resistance that ranges almost linearly with a resistive sensitivity of 0.0145 kΩ/° .

Almost linear change in resistance against bending angle

Hardware design

Once the characterization is completed and I fully understood the behavior of the resistive sensors, it was time to design and prototype the hardware solution for this project.

When designing for the hardware part, I knew that I had to find some ways to attach the sensors as close as possible to my fingers to get the most accurate finger angle reading. To do that, I had chose to use a simple cotton gardening glove. This turned out to be a great choice compared to other types of glove (fabric, leather) as it provided a few advantages:

  • Gardening gloves are very common and can be bought at almost any hardware store inexpensively.
  • Gardening gloves are also elastic, fitting the hand snugly to allow for the resistive sensors to be as close to the fingers as possible.
  • Can be easily modified by sewing and/or gluing.

To attach the sensors to the glove, I designed and 3D-printed some strain relieve clamps to fix the sensors in place and to provide strain relieve when the sensor is bent. A total of 5 sensors are attached on the glove, one for each finger. The sensors are sewn to the glove tightly lengthwise to ensure that the sensor is as close to the finger as possible.

Training Data Acquisition

Once the hardware prototype was made, I started collecting training data for the machine learning algorithm. The machine learning training was done on three sample objects: a sphere, a cuboid, and a cylinder. The objects are designed in a CAD software and 3D printed to ensure dimensional accuracy.

The training data is obtained by wearing the glove, pushing a push button connected to an Arduino to enable data logging, picking an object up and releasing it to form a dynamically changing time-series graph. Each sample consists of 150 data points, and each object was sampled 200 times for a total of 30,000 data points for each object. The samples are then labelled to the shape of the object it belongs to and exported to a CSV file format with a distinct name to allow for easy debugging and file navigation in the training stages.

SVM Model Training

After obtaining the training data for the three objects, an Support Vector Machine (a type of Machine Learning algorithm) classifier is implemented using Python’s scikit-learn library. The data is split into two sets: a test set and a train set. The data in the train set is used to fit the SVM model and hence will contain a majority of the data sample; while the data in the test set is used to provide an unbiased evaluation of the performance of the model. In my case, the train-test set was split by 80% and 20%, respectively. The data was also stratified. The test-train sets consisted of evenly distributed labelled data of each object to prevent a biased prediction. The fitted SVM classifier can then be used to predict an object’s shape on a real-time basis.

Results

The confusion matrix of the SVM models in the figure below shows that this artificial intelligence model can assist the glove in achieving more than 91% accuracy in recognizing the shape of objects. The kernel parameter, C, which is used to determine the possibilities of misclassification, was remained at the default and not optimized. Each object has 160 training samples and a testing sample of 40 samples (80% to 20% split). The baseline (not holding any objects) has a 100% prediction rate and the highest error appears to be the cuboid with 82.5% true predictions with 7 samples being predicted wrongly. This can be attributed to the lack of training samples and the accuracy might increase with higher training samples.

The real-time prediction of the glove was also realized by incorporating real-time input from the sensor into the trained SVM model. A button is pushed, sending a signal to the Arduino to start reading the sensor output and transmitting it to the Python program via serial communication. The SVM then takes the input data, parses it, and makes a prediction based on the trained samples. There are four possible outputs depending on the inputs, as shown below.

Conclusion

IoT Enabled Smart Shelf

In my third-to-fourth year of my bachelor’s degree, it is compulsory for my course to take a capstone course, called an Integrated Design Project. It is a project that spans over two semesters, and gives us the opportunity to demonstrate the knowledge and skills that we’ve learnt throughout our studies. It is different from a Final Year Project, as this is a group-based work.

In my group’s case, at the supervision of our group’s supervisor Dr Chang, we were requested by a company in Sri Kembangan, Selangor which specializes in manufacturing Gondola shelves and supermarket racks to provide a smart shelving system which is able to calculate the remaining stock on the shelf and logs them in a real-time basis. The requirement by the company was that we weren’t allowed to use any cameras to track stock movement. We had about seven months to design and implement a prototype, as well as complete a proposal and a presentation for our solution. A total of four of us, with me leading the Hardware and Software implementation of the shelf, started work as soon as was possible.

Once we found out the size of our prototype shelf, we came up with two solutions to our design; by using a weight sensor and an RFID reader. The two solutions that we provide is to allow for a pros and cons comparison between them. Once all the electronics have arrived, I started to work on the hardware and software designs for our prototype.

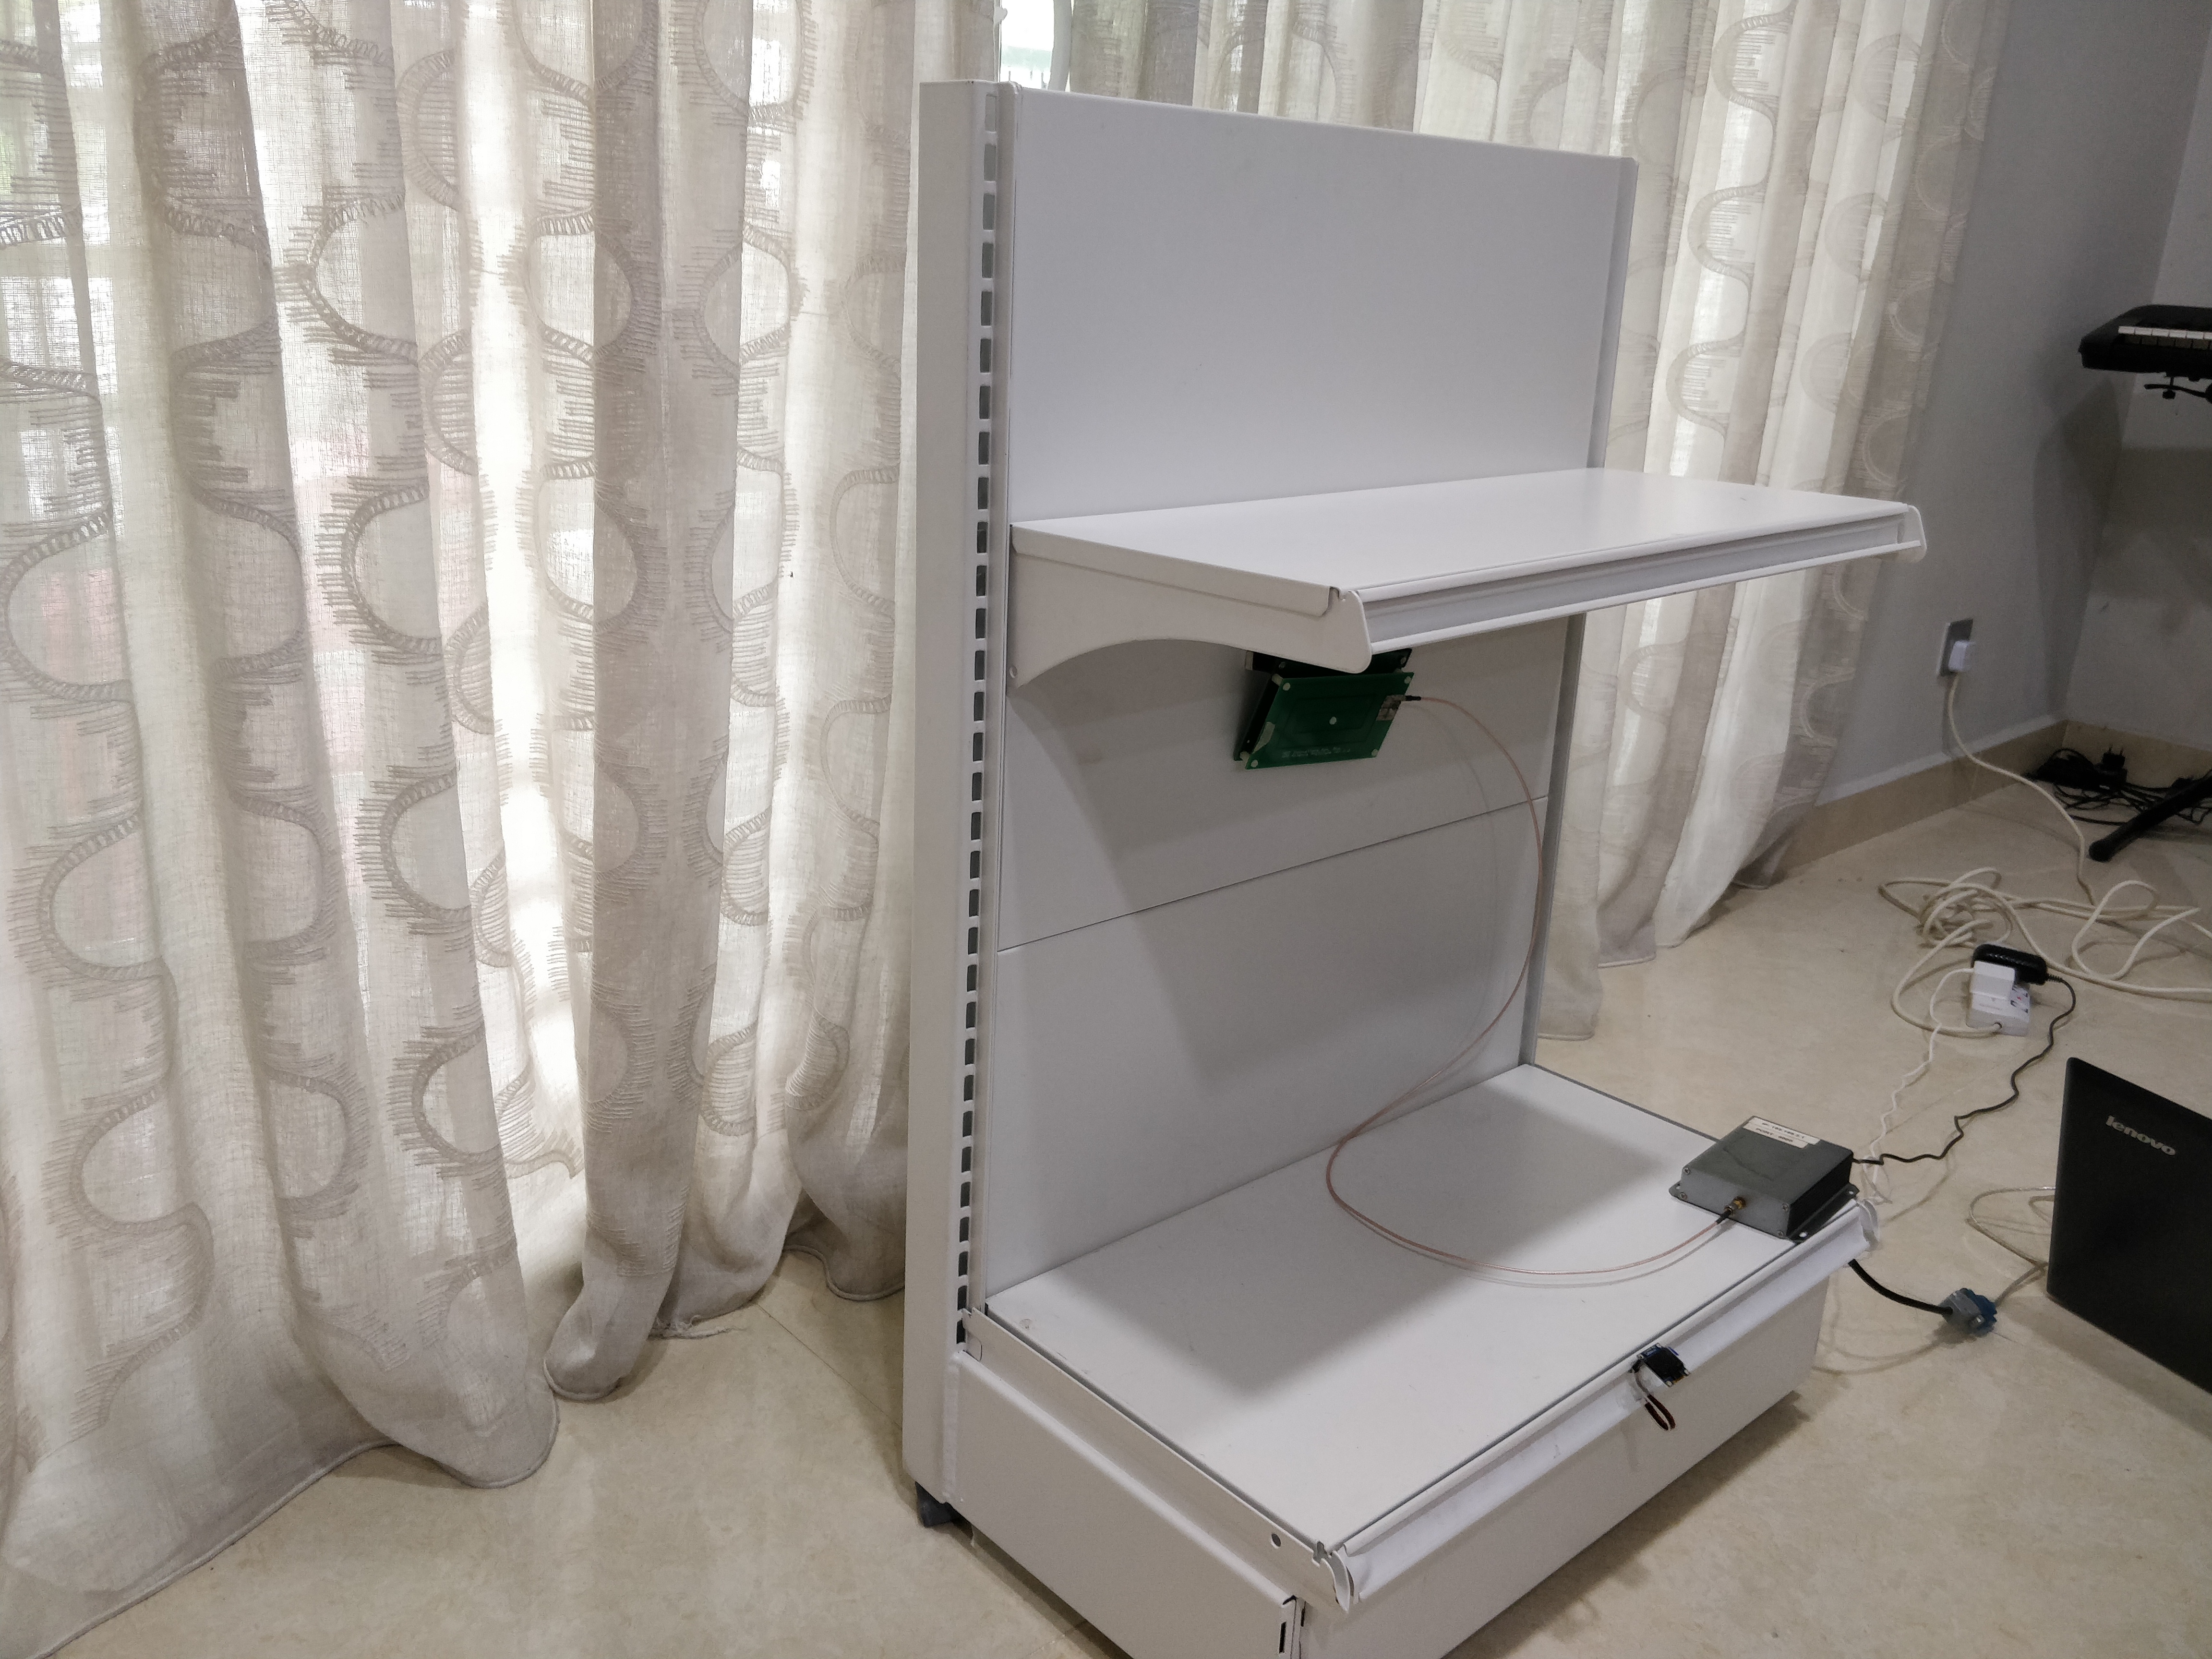
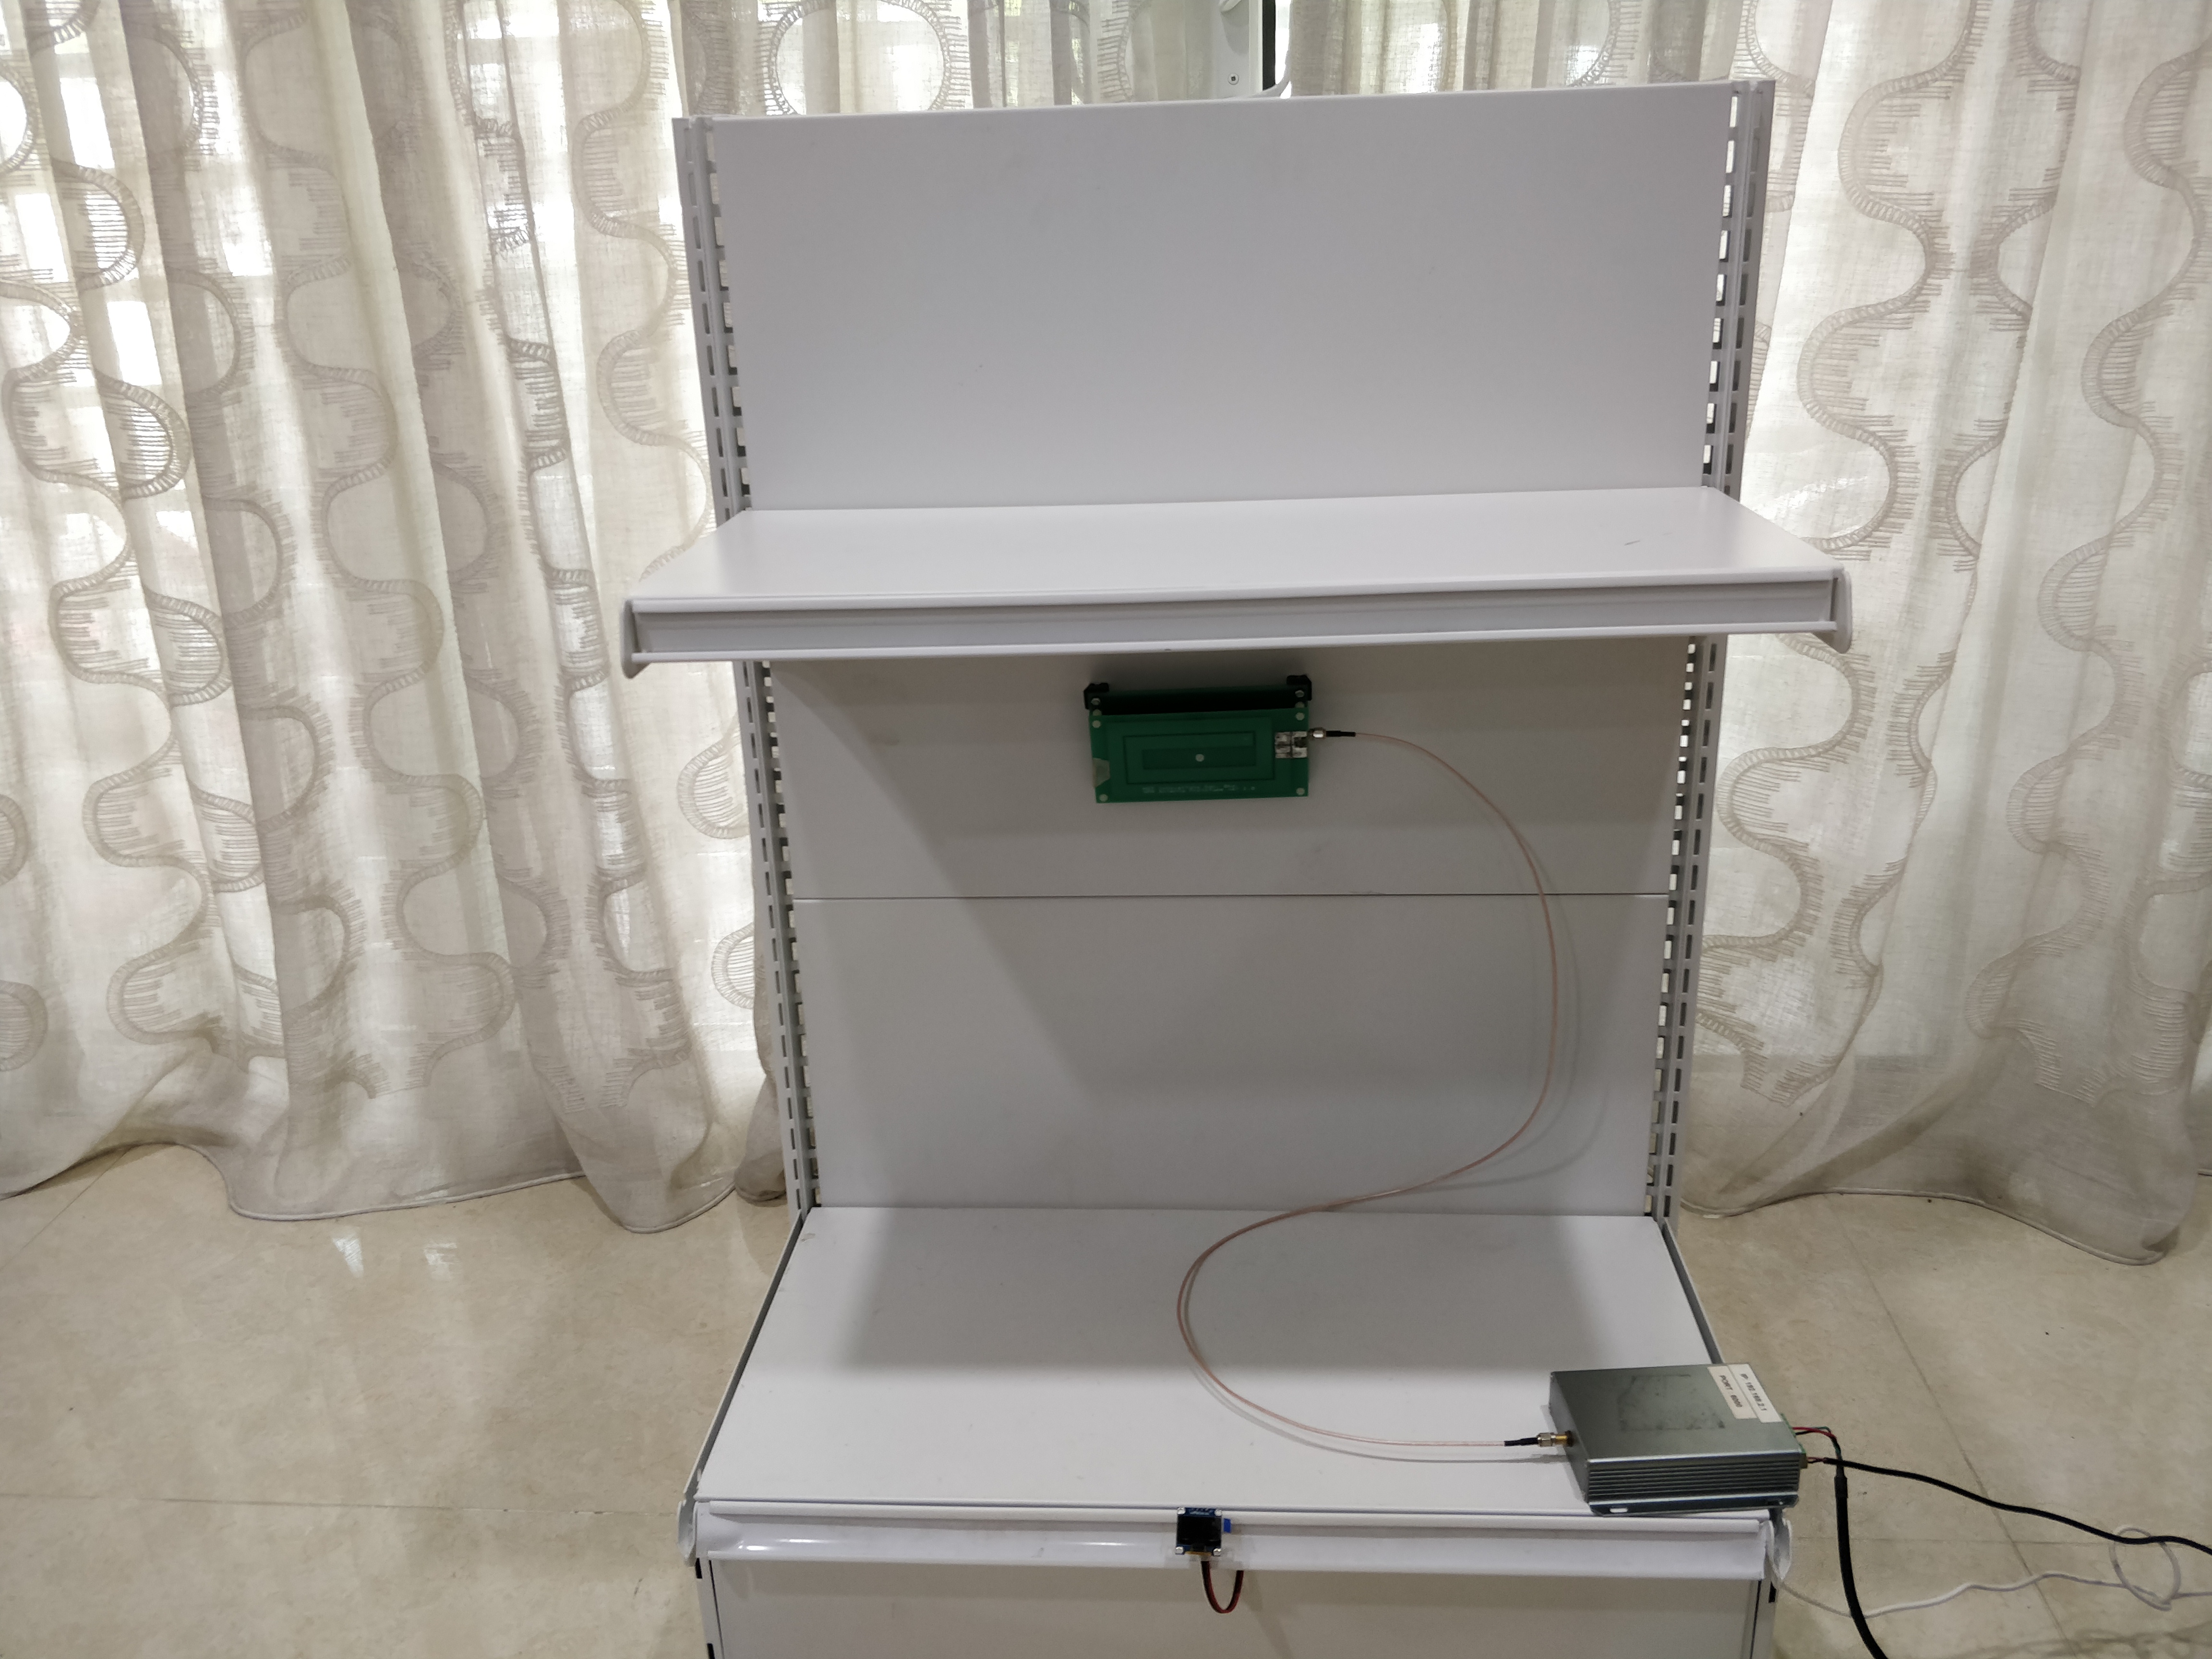
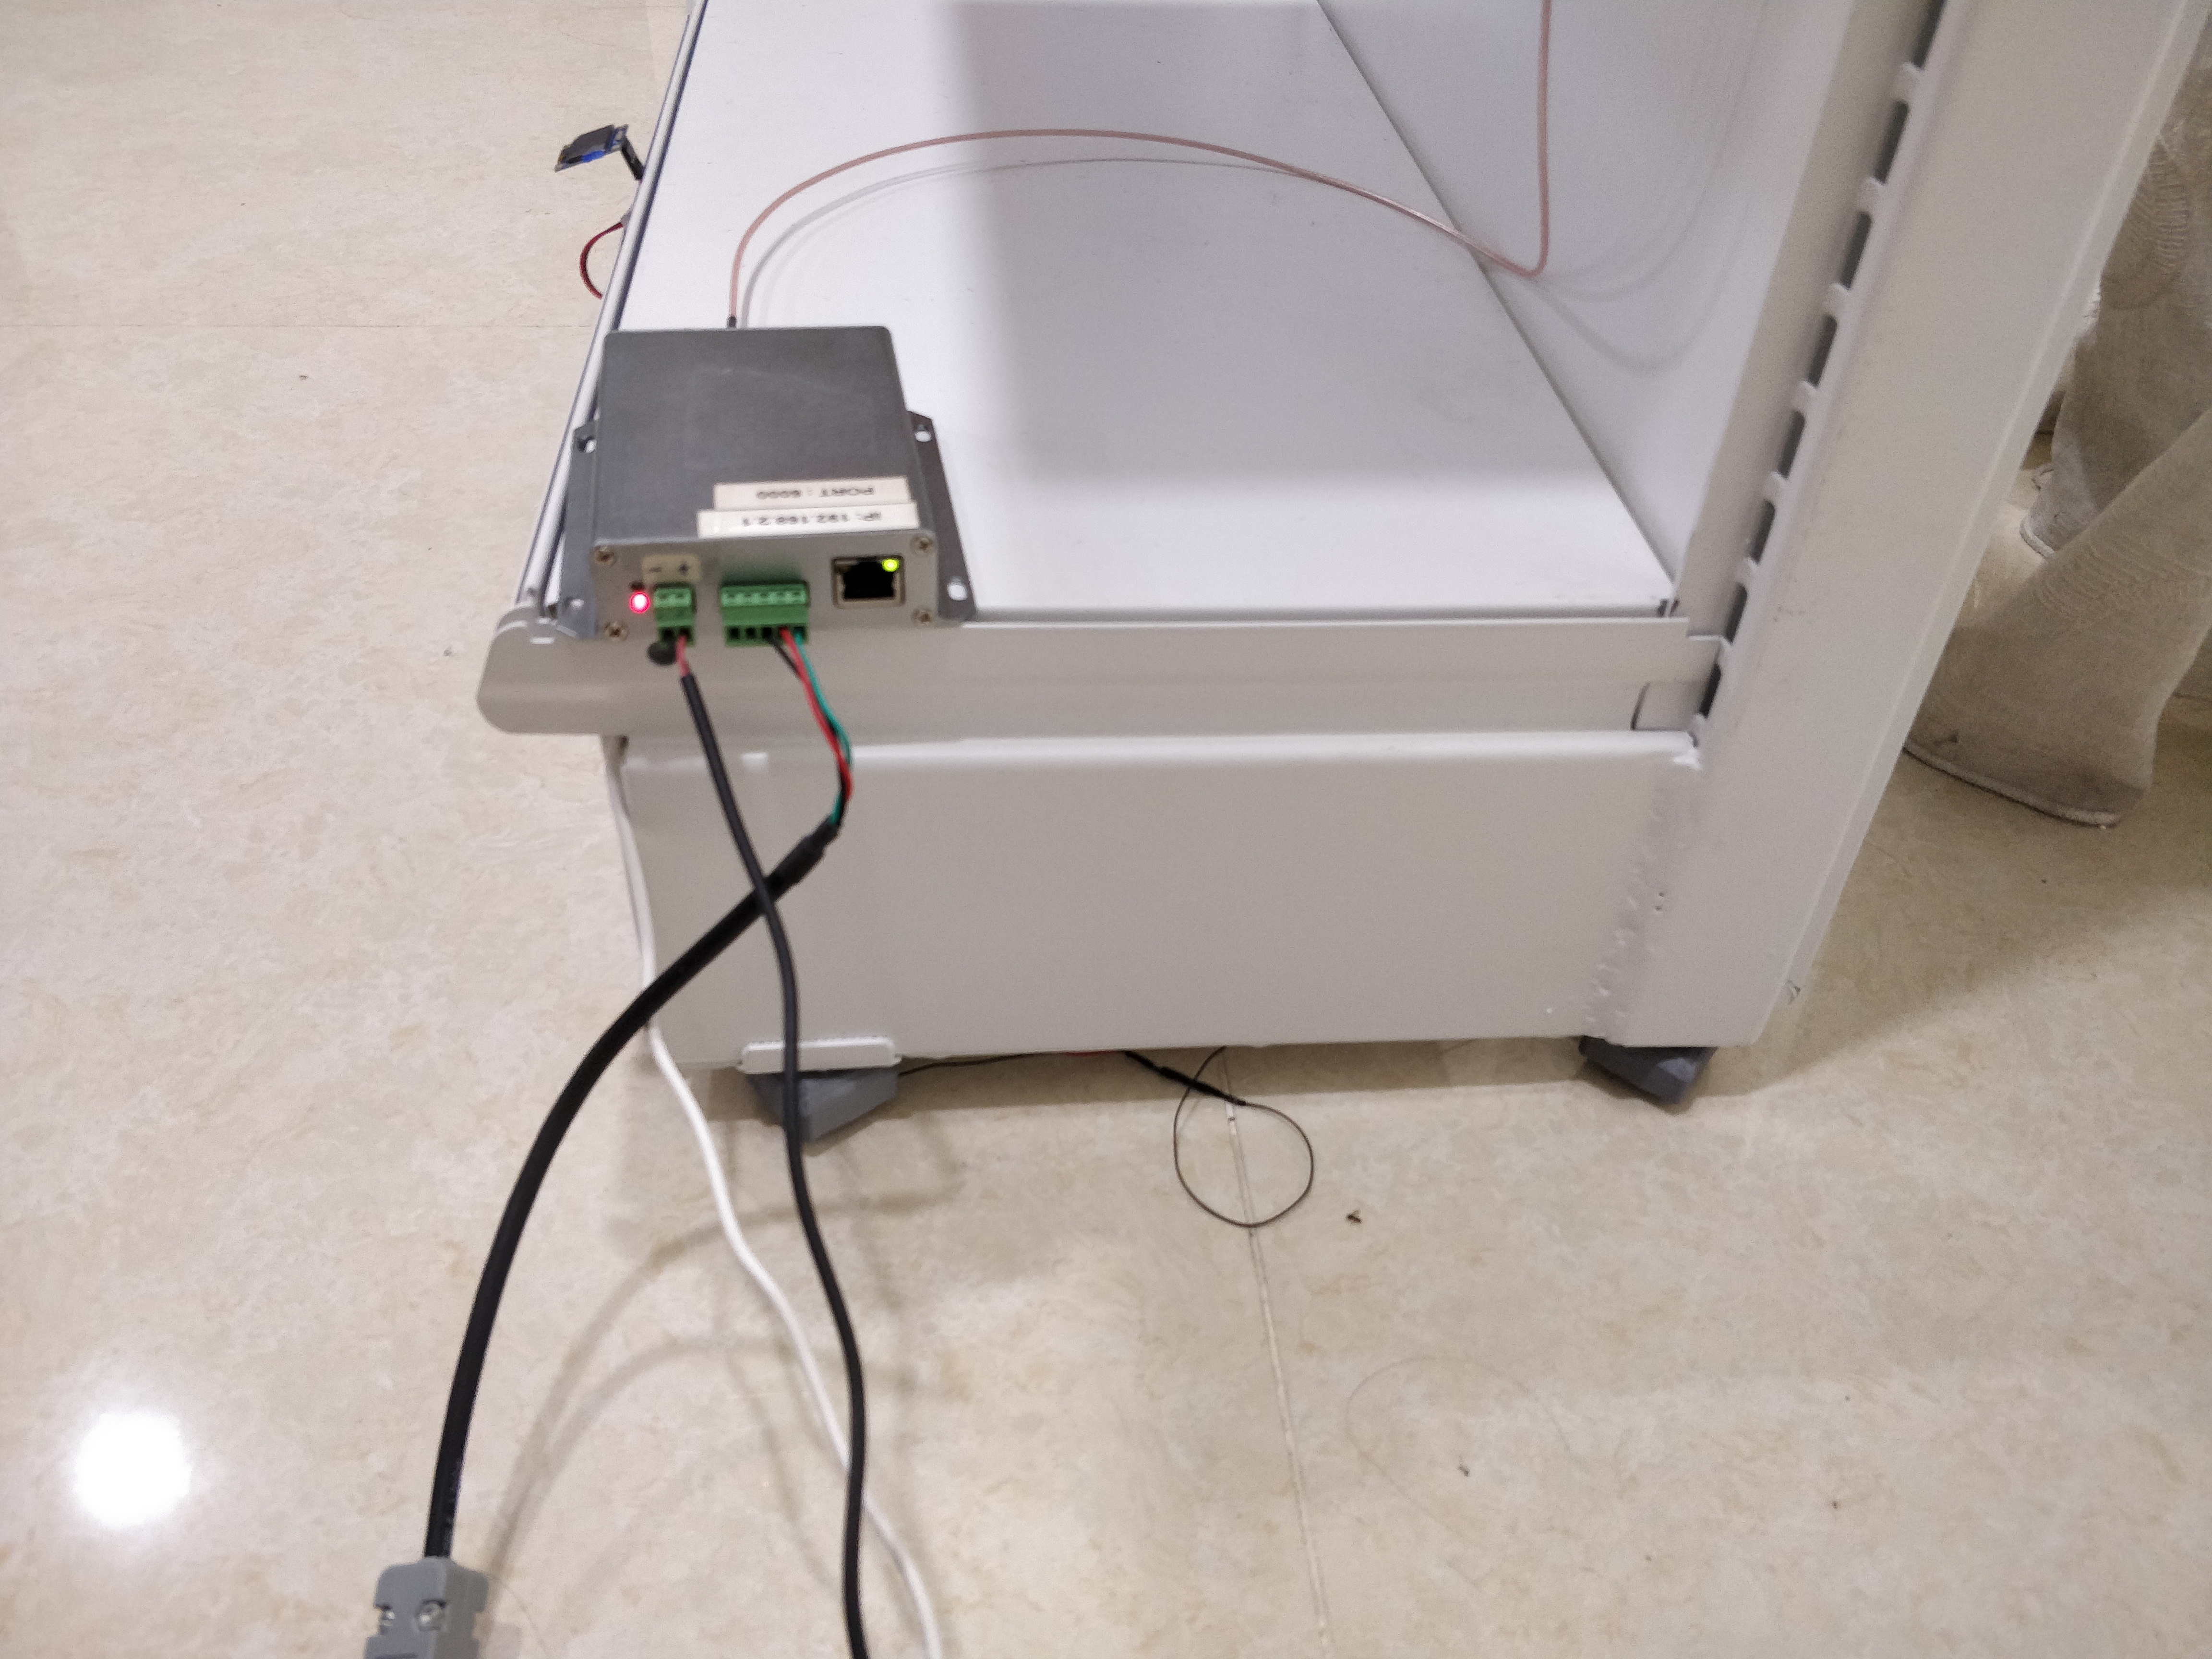
Mini shelf sponsored by our client for our prototype

Weight Sensor System

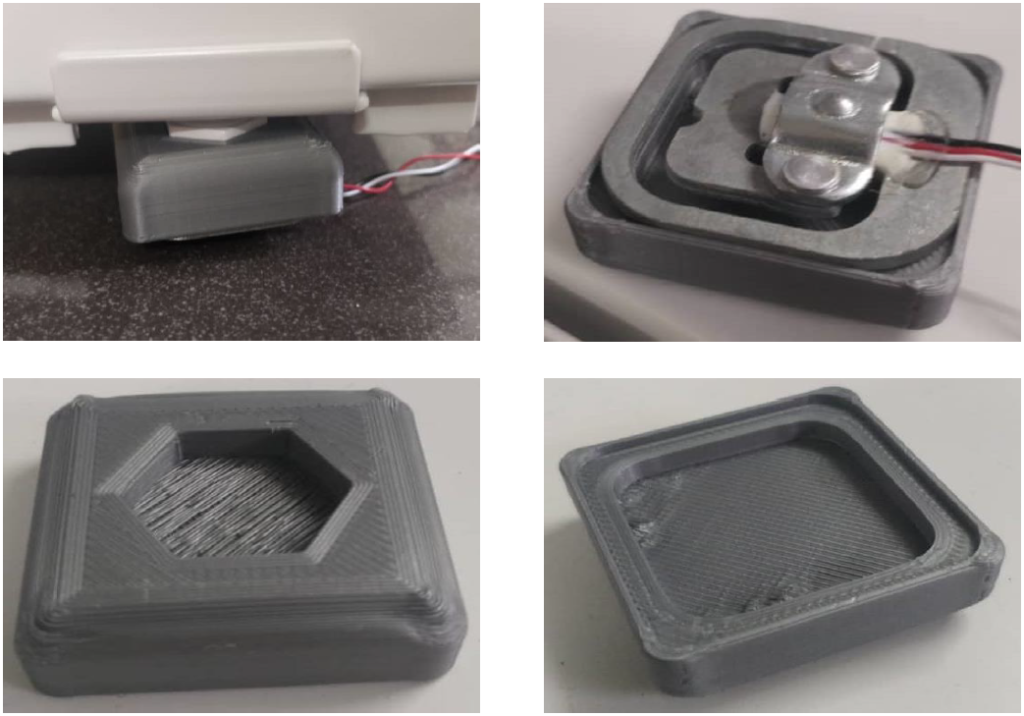
Firstly, I had to figure out how to attach the weight sensor onto the shelf. The four corners that’s holding up the entire shelf is screwed in with M.6 hex bolts and the weight sensors couldn’t fit on. Therefore, I had to design and 3D print an attachment part that allows for a snug fit between the weight sensor and the shelf. The parts are designed in Autodesk Fusion 360.

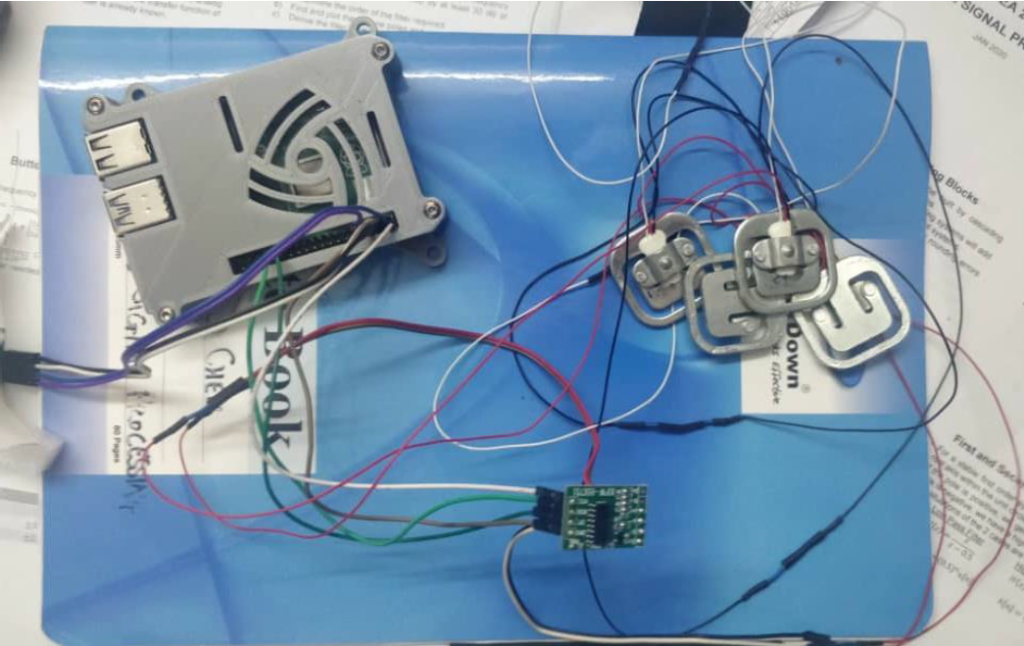
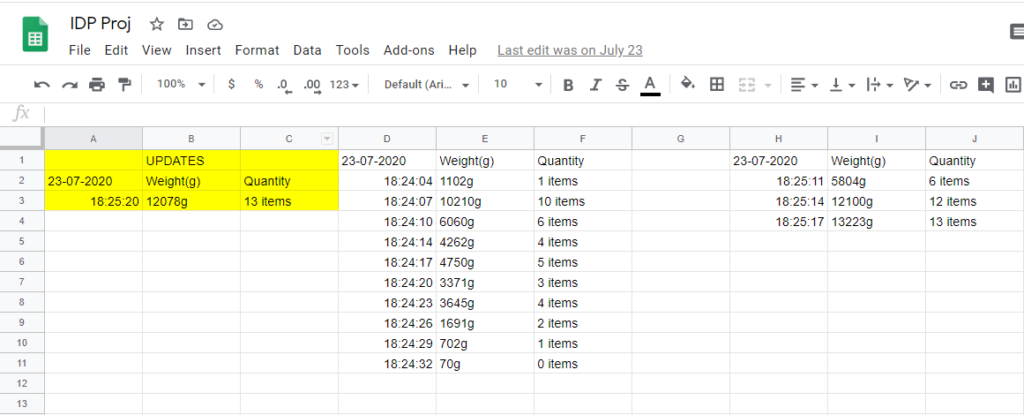
Once the parts are printed, and the weight sensors are attached on the four corners of the shelf, it was time to connect them up and start coding. The weight sensors are connected up to a HX711 Analog-to-Digital converter and the output of the HX711 is wired up to a Raspberry pi 4. After the testing was done, I started on the code. I programmed the raspberry pi to read the weight data from the shelf, divide that by the weight of one item on the shelf to get an approximate number of items on the shelf. I then programmed it to write the data to a Google Sheet page whenever there was a change in item quantity. I also connected an Oled screen to the raspberry pi to show the number of items on the shelf. The cons of using a weight sensor then became apparent – you can only measure one type of item with similar weights. However, this was not much of a problem as these weight sensors are rated to a high load and can be used in a manufacturing and shipping environment in which the products weight similarly in bulk.

Raspberry pi wired to the weight sensor with a HX711 ADC

The results we obtained was quite satisfactory. The weight sensors, although it may handle a high load (up to 200kg per sensor), does not lose its accuracy when measuring lighter loads. We were able to measure the weight changes up to ±5g accurately and update the google sheet in real time. One of my groupmate also developed an app to track the stock movements.

Here’s a short video of our initial system testing using the weight sensor:

Short demo of the weight sensor

RFID System

Next, I had to program for the RFID system of our project. The RFID reader was generously borrowed to us by another company specializing in RFID and IoT development. The RFID reader that they borrowed us did not come with a programmer’s manual and only had a ‘demo’ program. Hence, I had to think of a way to read the data off of the demo program and into my program.

I ended up using a python library called the PyTesseract, which is an optical character recognition library that can help me extract the valuable data from the demo program. I coded my program to take a screenshot of this demo program when it’s running, crop/resize it, and applied some filters to allow for the library to accurately recognize the unique ID (UID) of each RFID tags. The recognized UID can then be compared to a database to find out what product that UID is from. Once that was fully working, I had to program it to look for changes in the stock movement so that it may log it in Google Sheet which can be accessed through the same app that my groupmate created.

To attach the RFID antenna on the shelf itself, I had to design another part in Fusion 360. This part was made at an angle to ensure that the antenna has a maximum area of coverage with the tags. A magnet is embedded in the part to allow for the antenna to stick on the metallic wall of the shelf.

PCB design

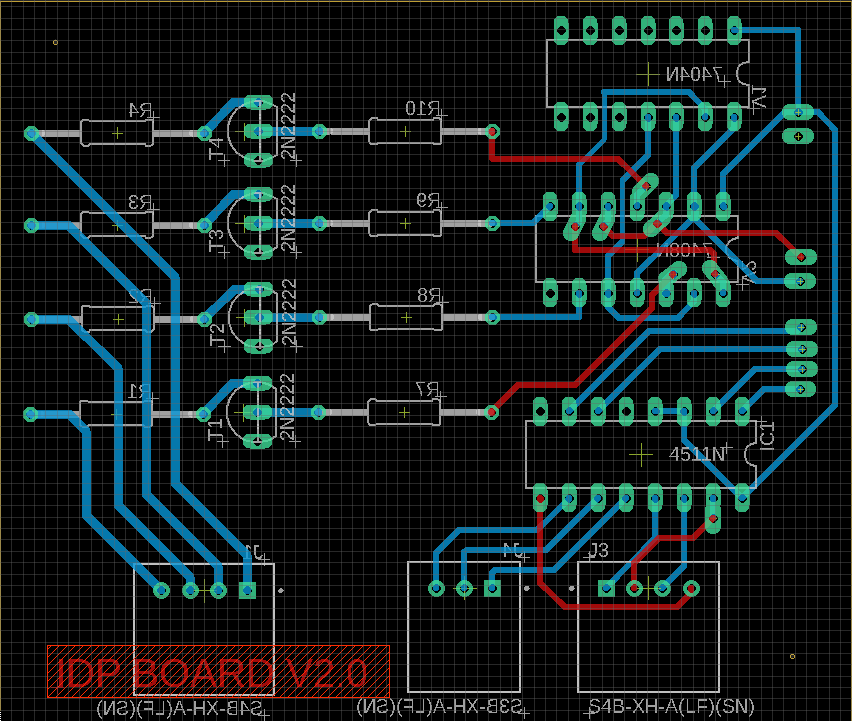
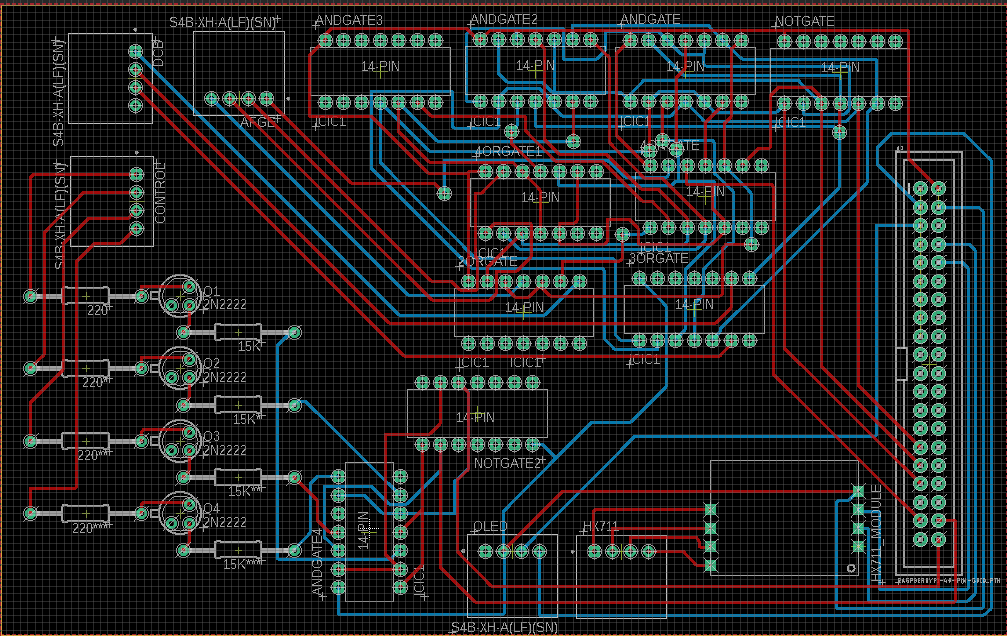
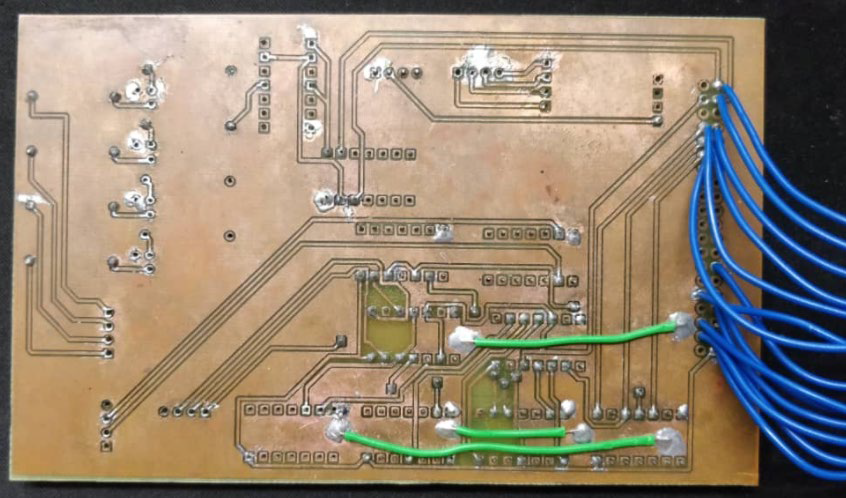
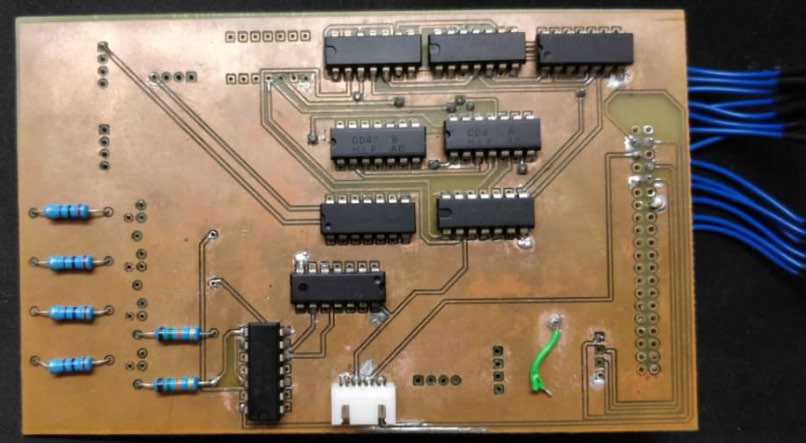
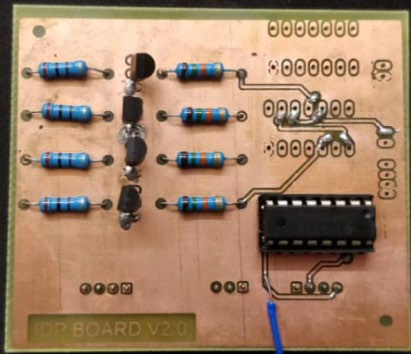
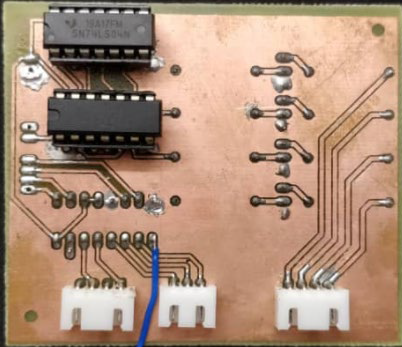
Once we got everything working as intended, we wanted to take it a step further and develop our own PCB to reduce all the wirings. So we designed our board in Autodesk Eagle and produced the PCB in the University’s PCB fabrication lab.

Unfortunately, after very thorough and time consuming testing and debugging, we couldn’t get the PCB to work. We suspect there might be stray capacitances and inductances within the traces which cause erroneous readings on the output. We finally opted to go back to the breadboard version due to the lack of time.

Here’s a demo video of our completed Weight sensor and RFID sensor system:

Additional Features

After the main hardware and software components of the shelf is done, it was time to add some additional features to make the shelf ‘smart’. Initially, we planned to implement a neural network to predict the sales data of future sales given the current sale. However, due to the lack of time and insufficient datasets, we opted for a pseudo-AI system instead. We were able to achieve four additional features with our prototype which includes:-

  • An android application
  • Weather sales prediction
  • Holiday sales prediction
  • Google Trends prediction

Android Application

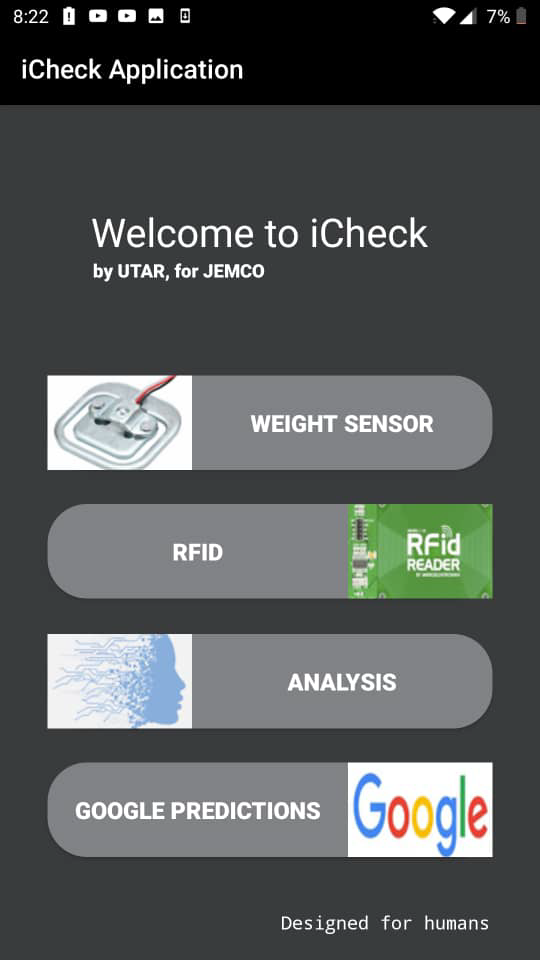
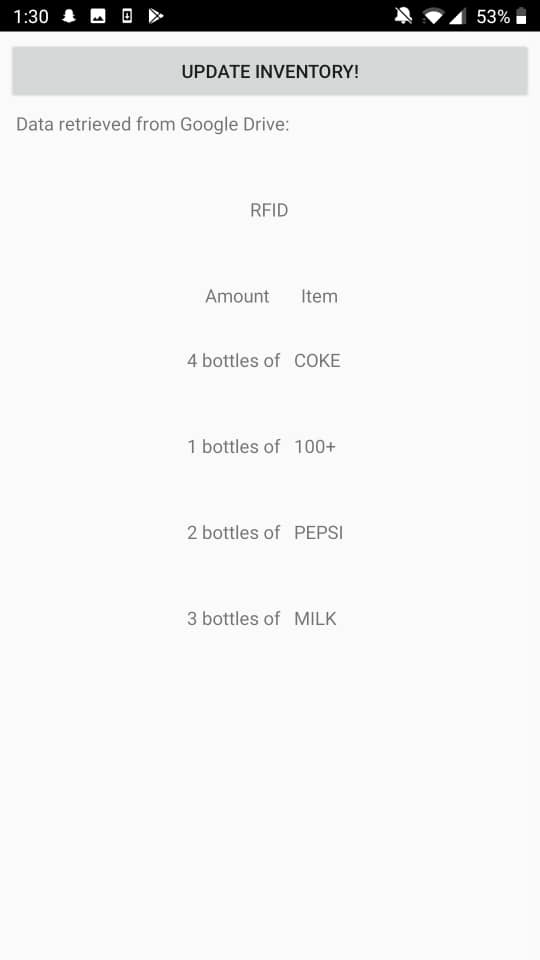
We’ve developed an app which allows a user to see the current product stock on the shelf which is meant for customers. We thought that at the current rampant stage of the covid-19 pandemic (at the time of this post), customers would more likely buy from a store in which they can check has their products in stock. This can also promote social distancing between the customers as they can check whether their items are in stock before going out to the store.

Holiday and Weather Sales Prediction

I’ve also coded a local holiday and a weather forecaster in our program, which is able to forecast the weather for the entire day as well as the local holiday for the next entire year. The program is able to make a pseudo-prediction on what the store should stock up on. These predictions will be updated every time the program is launched. In the future, if given enough time and sales data, there is a potential for true AI prediction that could be done based on previous holiday sales and weather data.

Google Keyword Analysis

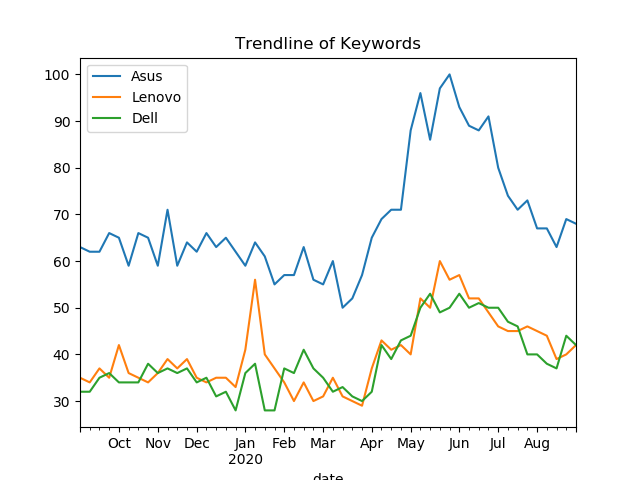
I’ve also added a Google keyword trendline which is based on Google keyword searches in an area. It compares the frequency of searches of different keywords and plots the frequency in a frequency-time graph. For example:

With the graph obtained above which shows the frequency of searches of laptop models; if you were a computer salesperson and wanted to set up shop in Malaysia, it is clear that Asus is the more searched laptop brand in Malaysia and it’s more likely that the sales of Asus will be higher than the other laptops. The program will update this graph each time it’s launched with real-time data.

Conclusion

After close to 7 months, we finally have a finished a working prototype. This project was chosen as one of the finalists in our university’s Best Capstone Project awards. The code of this project can be found in my Github page. This code will not work straight out-of-the-box as I’ve removed some personal API keys and files from the project but this project can be used as a reference for anyone interested in doing something similar. Thanks for reading!

Weaving Art Simulator

Introduction

A few months ago, I found an art piece done by Petros Vrellis in which he weaves an image by looping a long strand of thread over a circular rim over and over again and ever since then, I couldn’t stop thinking about how cool his work was. I couldn’t for the life of me figure out how a human could convert a picture into a series of lines on a circular panel…until I realized that it might not be a human that does it.

My Attempt and Results

After a few days have passed since I saw his work, an idea popped out of my mind. This idea that I had was to recreate his work, all while sitting in the comfort of my chair. My idea was that a user can input any picture of any size, and an algorithm will take that picture, resize it, crop it, and finally add lines to the picture until an output forms. The idea seems feasible and even simple at the time. Then I started to think about the details.

The challenge I gave myself in this project was that I wasn’t allowed to refer to any other similar work done on the internet. This project was to be done from my knowledge of programming. As always, I started out planning on my sketchbook on how I would approach this project. Below are some of the more readable snippets of my sketch.

Once I have the idea in place, it was time to start coding. I first had to choose which language to code in. Since I have thought about using vectorization as a method to approach this problem and have a decent background in Python, that will be the language I’ll be using for this algorithm. Python may not be the most computationally efficient program, but it seemed to work just fine for my algorithm.

Fast forward to the next few months of off-and-on coding and many(many) head scratching moments, I have finally made a working simulation of Petros’ work. The results shown below are all done with the same parameters (6500 lines with 256 pins around the rim).

Original Picture: Monalisa

Comparison between transformed picture and my algorithm’s picture

Simulation of the thread art when done at 50 lines per frame

Original picture: Simba, chilling on my 3D printer

Comparison Image: Still as cute!

50 lines per frame GIF of the threading process

How It Works

The following parts will try to explain how the algorithm works and it will be the more technical part of this post. If you have no interest in how this algorithm work, you may skip straight to the conclusion.

My algorithm works by first having a user input an image, specifying the number of pins around the circumference and specifying the number of lines that the program will input (a higher number of lines and pins will output a higher ‘resolution’ image). There are a few other parameters that can be changed in the program, which includes the line thickness, the minimum line distances between each line (to prevent short lines), and also minimum steps the line has to take before going back to the same pin (to prevent an infinite loop). Tweaking and perfecting these parameters will allow for a better looking outcome.

After setting the parameters, the image defined will then undergo a series of transformations and filters to ensure the image is cropped to a circle and is in grayscale. The algorithm then stores the coordinates of all possible pins as well as the line distances between the two pins by applying the pythagorean theorem. The coordinate points along the line are then calculated and stored for all possible combination of lines.

The algorithm then loops to find the ‘best’ pin to form a line. The best pin is determined by summing the total black intensity along the line and picking the line with the highest intensity. Once the best pin is found, the coordinates are stored in a list and the intensity of the picture along the line is then reduced by a factor defined as the line thickness and the process repeats until the number of lines are reached.

The algorithm also takes a screenshot every X lines (defined by user) when the ‘GIF creation’ option is enabled. When the process completes, the frames are stored in a folder, and the ImageIO library is used to compile the frames into a GIF. The program also outputs a file which includes all the pin sequences if you plan to remake this in real life.

With the testing parameters in the results section, the simulation can be completed in around 1 minute when done with my low-end Lenovo laptop. However, when the GIF creation option is enabled, the time it takes skyrockets up to around 25 minutes. This may be caused by the inefficiencies of saving the frames before combining them to form a GIF.

Conclusion

Overall, I’m really satisfied with the the outcome of this project. If I were to take this to the next step, future plans may include an automated hardware which inputs the file that this algorithm provides, and automatically loops the thread for me. The code used in this project are open sourced can be found on my Github page so you can try it out yourself, provided you have the necessary libraries installed. Thanks for reading!